.webp)
Guide
HubSpot Bulk Text Messaging
Set up and send SMS in HubSpot fast
MESSAGING ANALYTICS
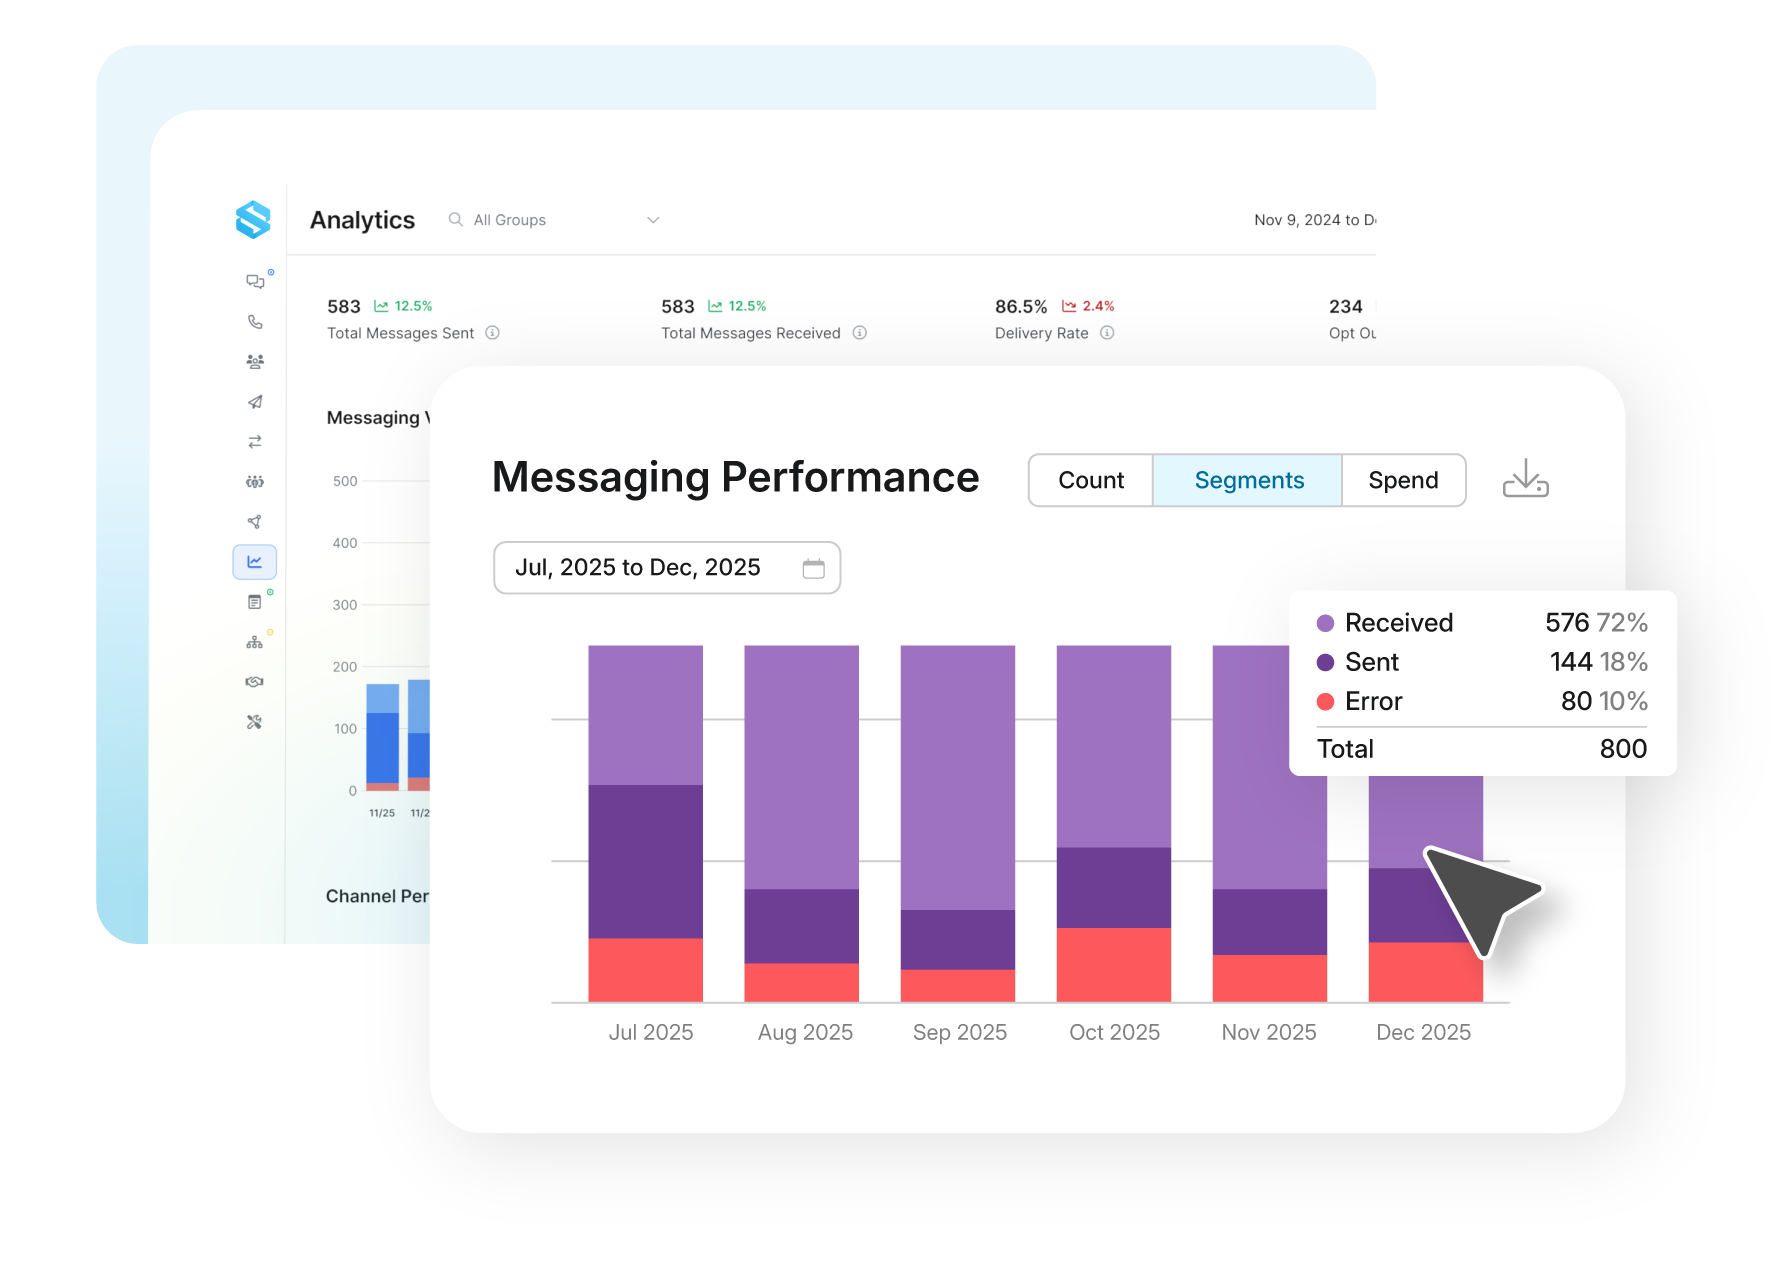
Sakari Analytics gives you clear visibility into message volume, spend, delivery trends, opt-outs, and errors across your account so you can identify issues, improve delivery, and optimize campaigns.

PERFORMANCE SNAPSHOT
Instantly view total messages sent and received, delivery performance, and opt-out rates with clear comparison indicators against previous periods. A single snapshot gives teams immediate visibility into messaging health without digging through reports.
.webp)
VOLUME AND SEGMENT TRENDS
Track messaging volume across customizable date ranges with daily, weekly, monthly, or yearly views. Toggle between message counts and segments to understand campaign activity, identify spikes, and monitor trends across groups or numbers.
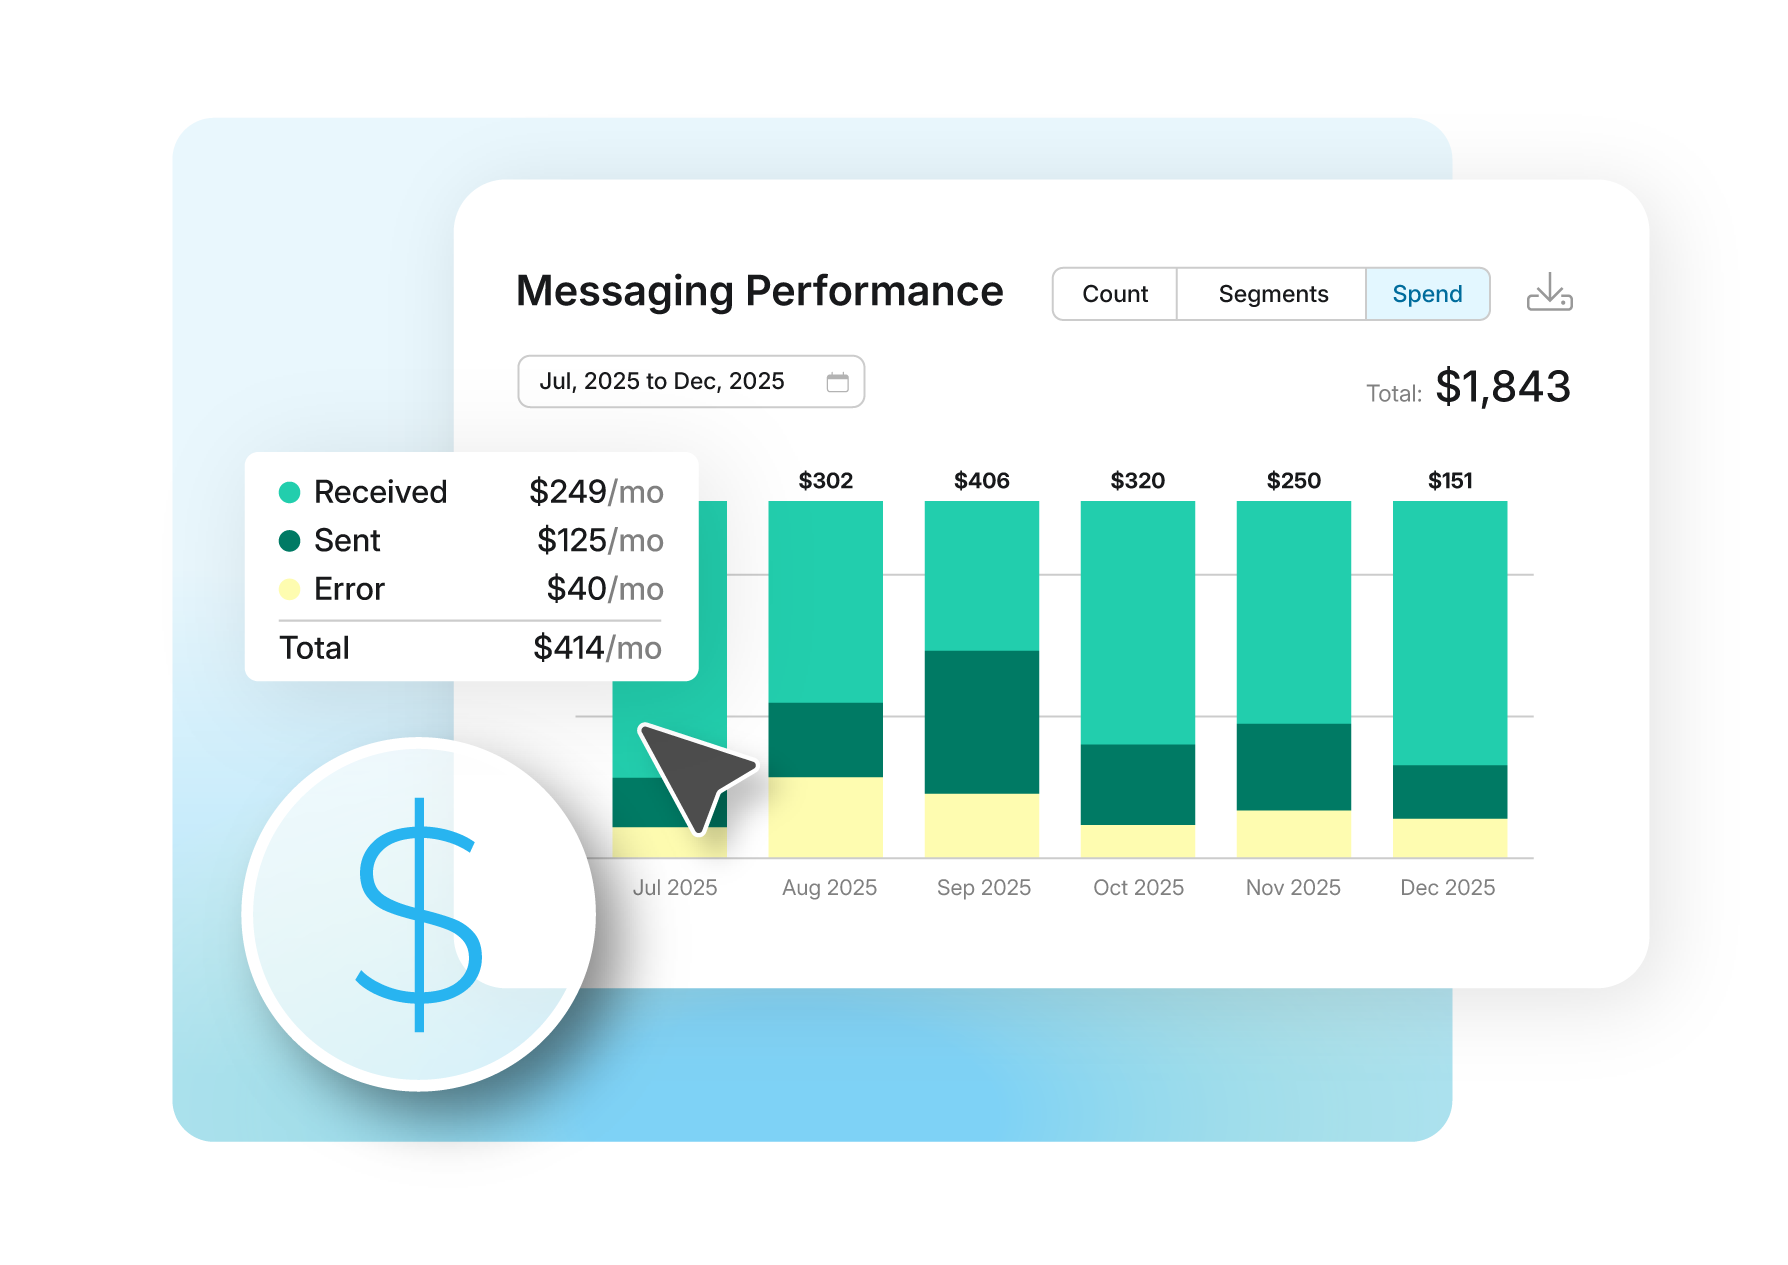
SPEND AND ERROR DIAGNOSTICS
Monitor messaging spend over time while drilling into error categories to identify delivery issues such as carrier rejections or compliance blocks. Clear cost visibility and structured error reporting help teams maintain performance and control.
GLOBAL MESSAGING INSIGHTS
Visualize sent, received, and error volume across countries with an interactive, global heat map built for scale. Intensity-based coloring and detailed breakdowns help teams quickly identify trends, monitor regional performance, and spot delivery issues worldwide, all from a single, unified view.
.webp)
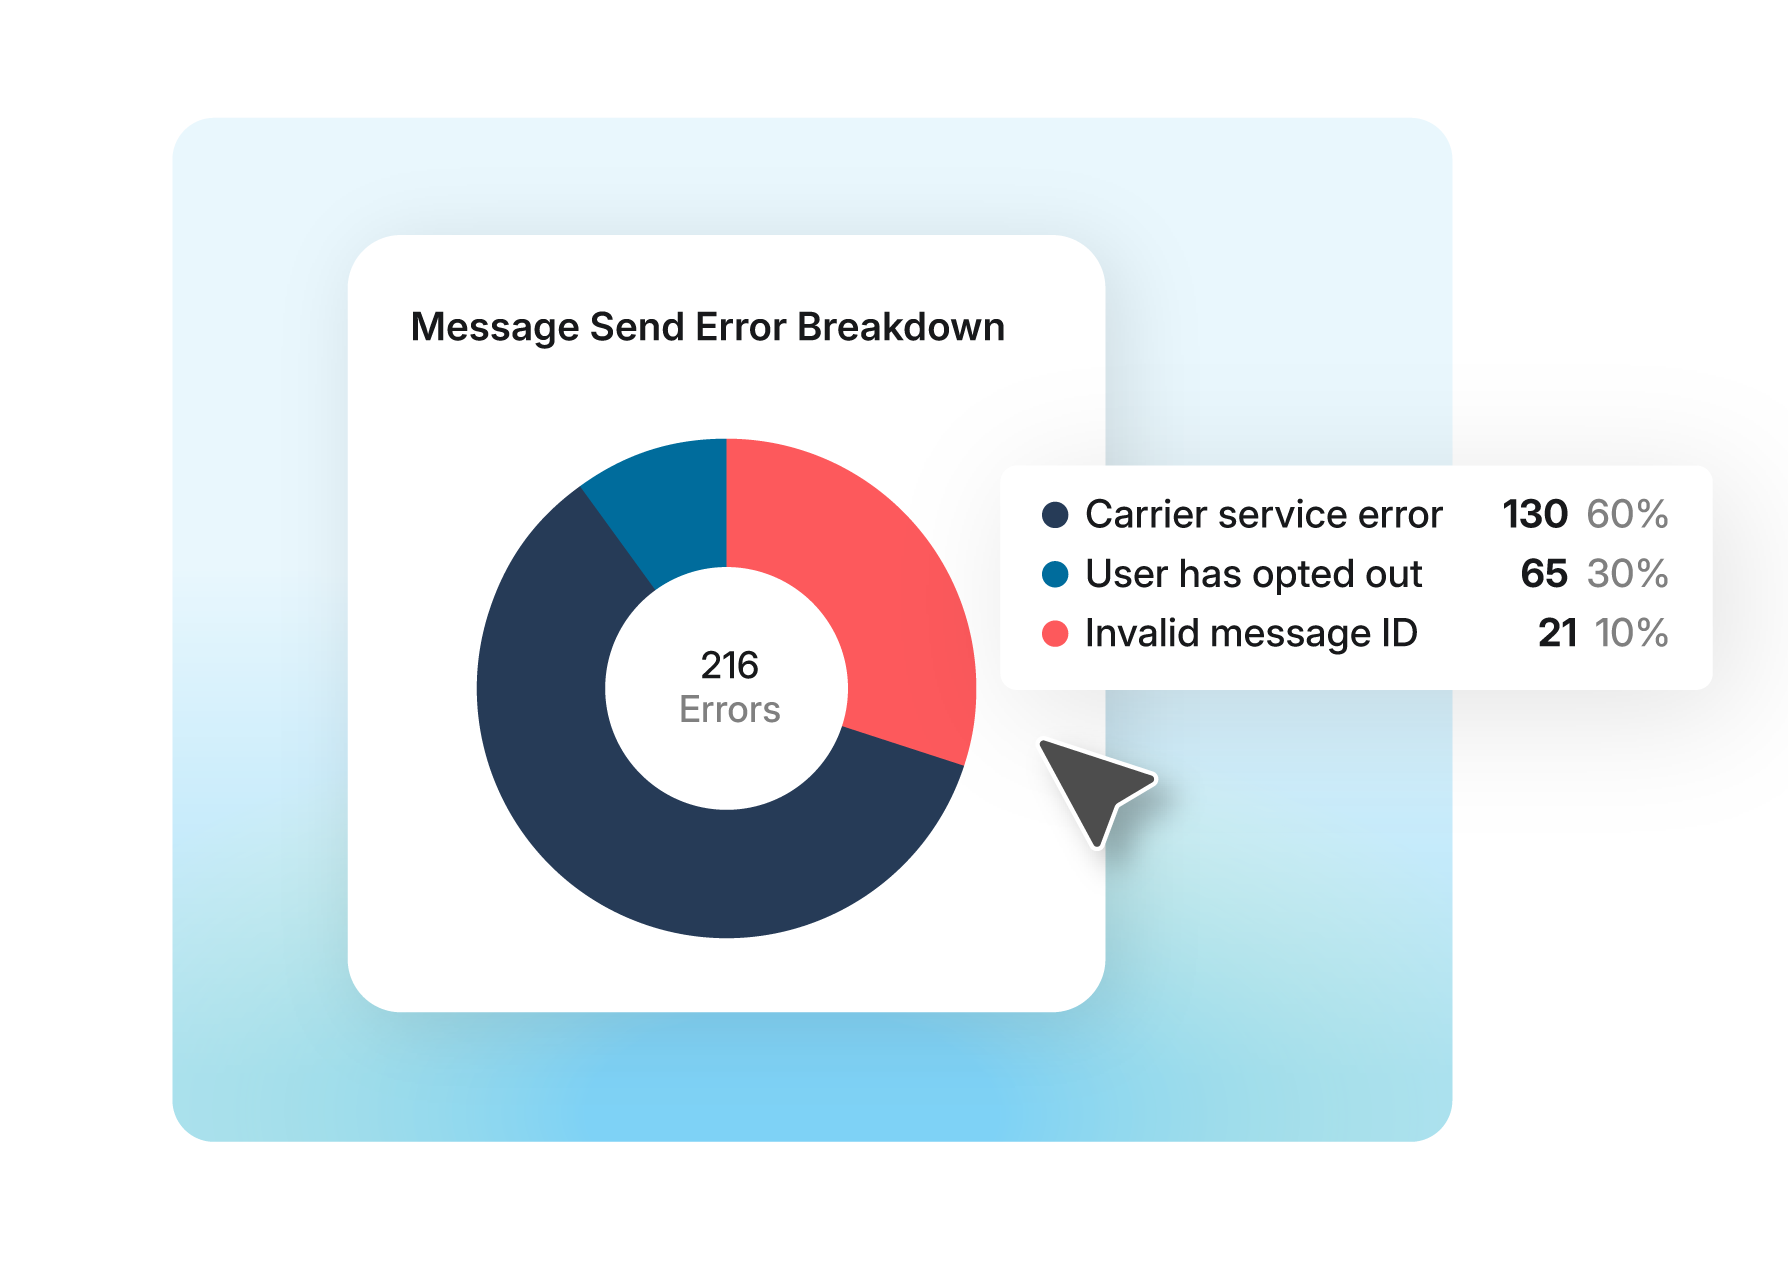
Analyze structured error reasons including carrier rejections and compliance-related blocks to quickly identify patterns and improve delivery health.
Try it Free
Export structured reports instantly or receive detailed message-level data by email, all reflecting your selected date range, group, or phone number filters.
Get Started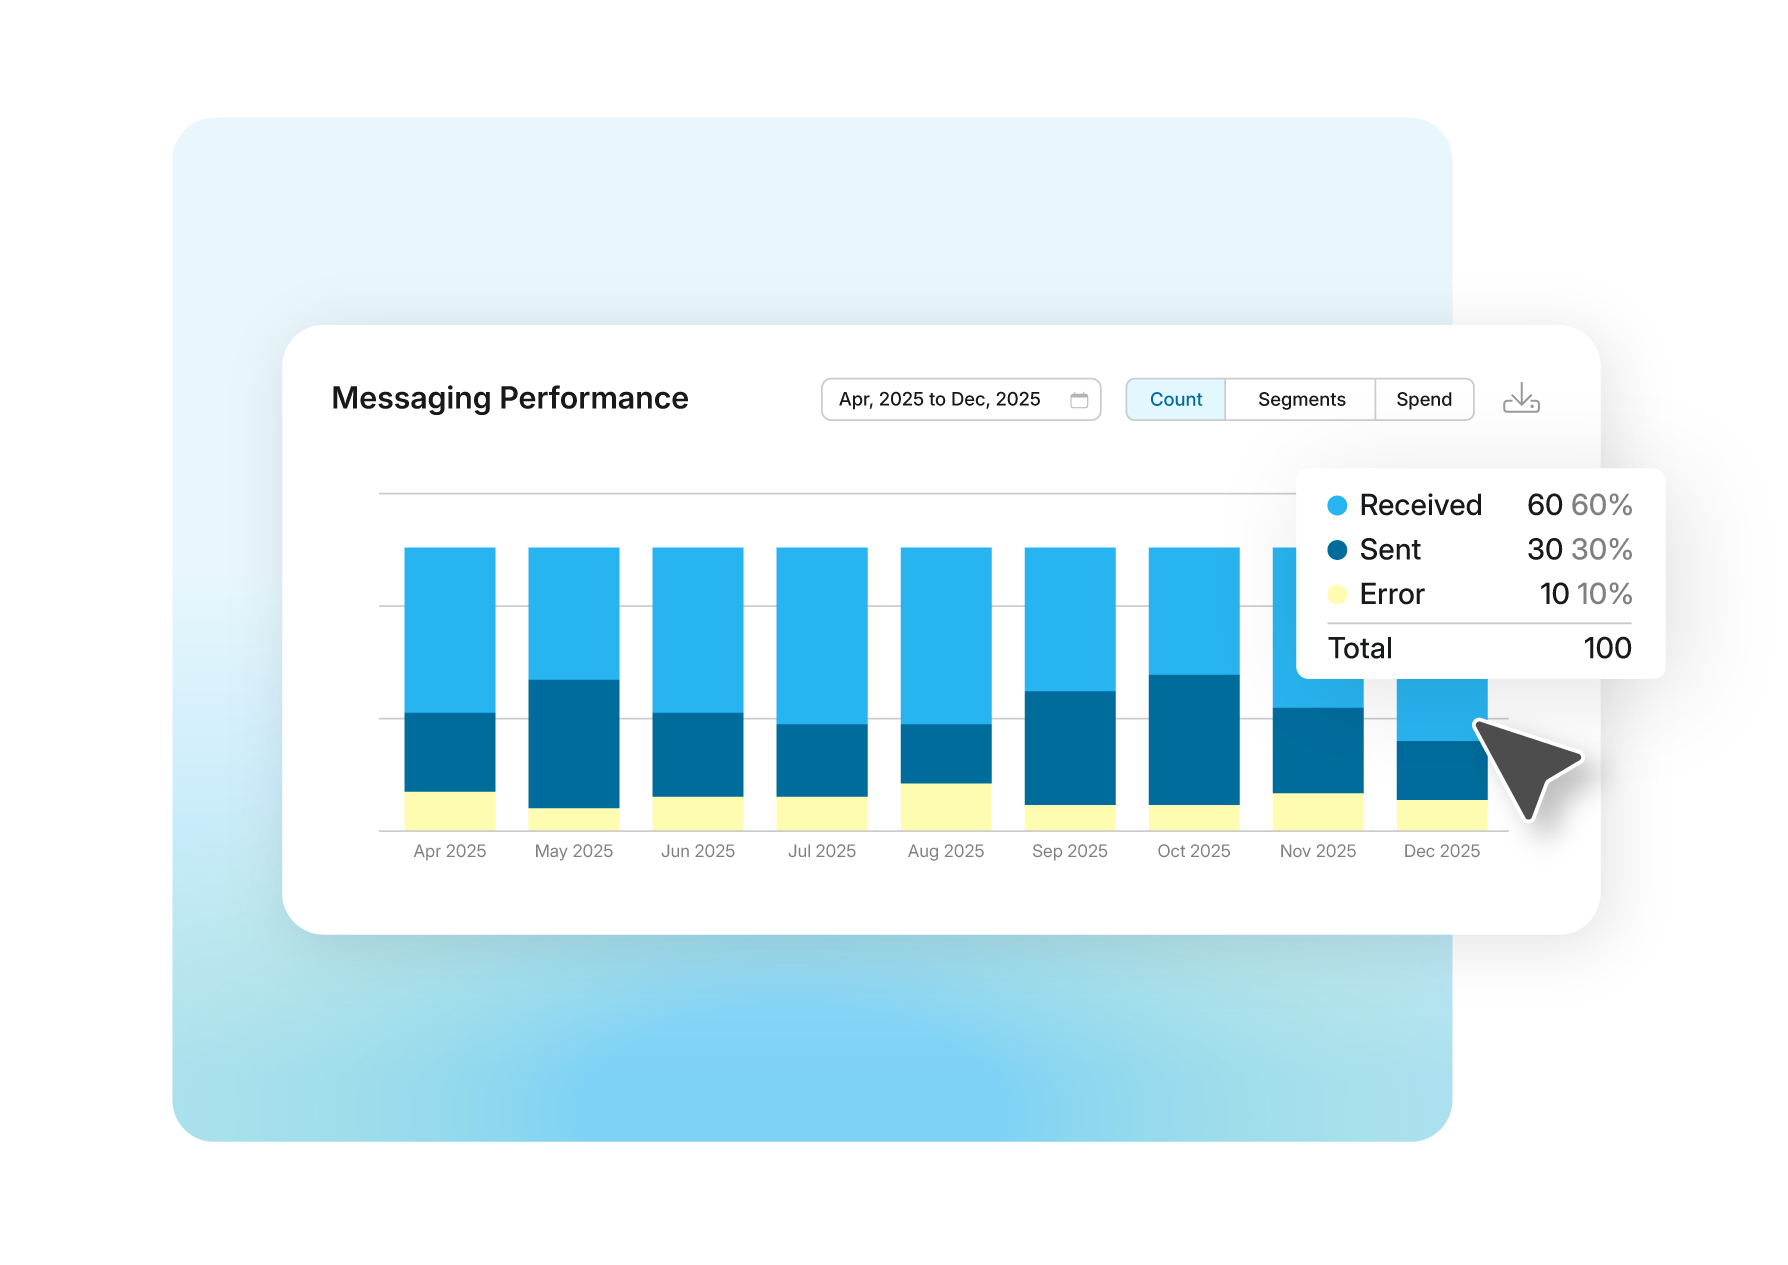
View messaging volume across customizable date ranges with daily, weekly, monthly, or yearly granularity. Quickly spot spikes, seasonality, or unusual changes across your account, groups, or numbers.
Free Trial
Connect your tech stack with native integrations and flexible API access. Quickly scale communications globally, reduce friction and accelerate every customer’s journey.
Learn More
THE RESOURCE HUB
.webp)
.webp)
.webp)
.webp)
.webp)
.webp)